


I still remember my first marathon, where I thought I had it all figured out, but my running data from Strava told a different story. I had been using the app to track my runs, but I wasn’t really analyzing my running data – I was just looking at the pretty maps and feeling good about my mileage. It wasn’t until I dug deeper into the numbers that I realized I had been stuck in a plateau for months. That’s when I learned the power of how to analyze your running data from Strava to supercharge my training.
In this article, I’ll share my personal approach to how to analyze your running data from Strava, including the metrics that matter most and the simple tools you can use to gain insights. You’ll learn how to move beyond just tracking your runs and start using your data to inform your training decisions and crush your goals. Whether you’re a seasoned runner or just starting out, I’ll show you how to unleash the full potential of your Strava data to become a stronger, faster, and more efficient runner.
Table of Contents
Guide Overview: What You'll Need

Total Time: 1 hour to several hours
Estimated Cost: free – $10 per month for Strava premium
Difficulty Level: Intermediate
Tools Required
- Computer or Mobile Device with internet connection
- Strava Account with running data uploaded
Supplies & Materials
- Basic Math Skills for data analysis
- Data Analysis Software such as Excel or Google Sheets, optional
Step-by-Step Instructions
- 1. First, let’s get started by logging into your Strava account and navigating to the dashboard, where you’ll find an overview of your recent activities. This is where the magic begins, and you’ll start to uncover the hidden gems in your running data.
- 2. Next, click on the “Activities” tab, which will take you to a list of all your recorded runs. Here, you can start to _filter_ your activities by date, distance, or type of run, allowing you to focus on specific periods or events. This is a great way to identify trends and patterns in your running.
- 3. Now, select a specific activity, such as a recent run, and click on it to view the detailed analysis. Strava will provide you with a wealth of information, including your pace, distance, and elevation gain. Take a close look at these metrics, as they’ll give you a solid understanding of your performance.
- 4. To gain even more insights, click on the “Segments” tab, which will show you how you performed on specific sections of your run. This is where you can identify areas for improvement and _optimize_ your route to maximize your efficiency. Look for segments where you can push yourself to beat your personal records.
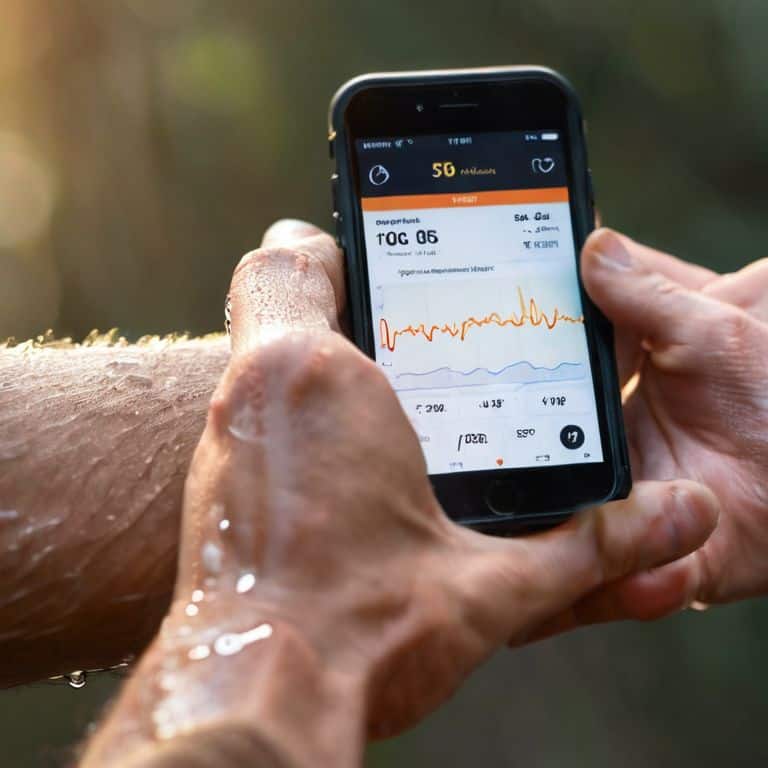
- 5. Another crucial aspect of analyzing your running data is to examine your heart rate and cadence. These metrics can provide valuable information about your physical condition and running technique. By monitoring your heart rate, you can identify periods of high intensity and adjust your training accordingly.
- 6. Moving on to the “Insights” tab, you’ll find a treasure trove of data visualizations and charts that help you understand your running trends. Here, you can explore your monthly mileage, average pace, and longest run, among other metrics. These insights will help you identify areas where you need to improve and set realistic goals for your future runs.
- 7. Finally, take your analysis to the next level by using Strava’s power metrics, which provide a detailed breakdown of your running power and efficiency. This advanced data will help you fine-tune your training and make adjustments to your technique, allowing you to run more efficiently and effectively. By leveraging these power metrics, you’ll be able to _take your running to the next level_ and achieve your goals faster.
Unleash Your Strava Power
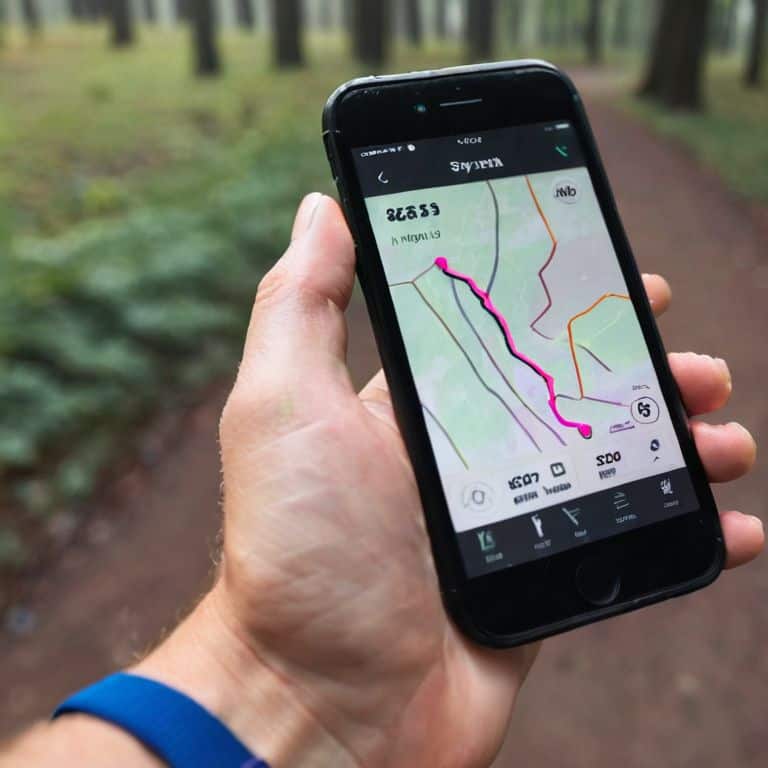
As you dive deeper into your Strava data, you’ll want to explore strava data visualization tools that can help you make sense of your running performance metrics. These tools can provide a clearer picture of your progress, allowing you to identify areas for improvement and track your growth over time. By leveraging these tools, you can gain a deeper understanding of your running habits and make data-driven decisions to optimize your training.
One of the most powerful features of Strava is its gps tracking for runners, which enables you to map your routes and track your progress with precision. This feature is especially useful when combined with heart rate zone training, as it allows you to monitor your physical exertion and adjust your training accordingly. By using these features in tandem, you can create a highly effective training program that’s tailored to your unique needs and goals.
To take your training to the next level, consider working with a data driven running coach who can help you interpret your Strava data and develop a personalized training plan. This can be a game-changer for runners who are looking to optimize their performance and achieve their goals. By combining the power of Strava with expert coaching, you can unlock your full potential and achieve remarkable results.
Gps Tracking for Runners Heart Rate Zone Training
To take your training to the next level, I recommend leveraging GPS tracking for heart rate zone training. This powerful combination allows you to optimize your workouts and reach new heights. By syncing your GPS data with heart rate monitoring, you can identify the most effective pacing strategies and make data-driven decisions to boost your performance.
I’ve seen firsthand how this approach can transform a runner’s regimen. By analyzing my own heart rate data alongside GPS tracking, I’ve been able to refine my marathon training and achieve significant gains. With the right wearable and a solid understanding of heart rate zones, you can unlock similar breakthroughs and take your running to new distances.
Mastering Strava Data Visualization Tools
Now that you’ve unleashed your Strava power, it’s time to take your data analysis to the next level with Strava’s data visualization tools. I’m obsessed with digging into the nitty-gritty details of my runs, and Strava’s graphs and charts make it easy to do just that. By mastering these tools, you’ll be able to pinpoint areas for improvement and track your progress over time.
I love using Strava’s pace charts to identify where I can pick up the pace, and their elevation graphs to plan more efficient routes. With a little practice, you’ll be able to do the same, using data to inform your training and push yourself to new heights. Trust me, there’s no better feeling than seeing your hard work pay off in the form of faster times and longer distances.
5 Game-Changing Tips to Supercharge Your Strava Analysis
- Focus on Progress, Not Perfection: Use Strava’s performance condition and training load metrics to track your progress over time, rather than getting discouraged by individual bad runs
- Unlock the Power of Splits: Break down your runs into segments to identify areas for improvement, such as pace, heart rate, and cadence, and adjust your training accordingly
- Heart Rate Zone Training: Use Strava’s heart rate zone features to optimize your workouts, ensuring you’re spending the right amount of time in each zone to achieve your goals
- Get Granular with Pace Distribution: Analyze your pace distribution to identify patterns and trends in your running, such as whether you tend to start too fast or finish strong, and adjust your strategy to optimize your performance
- Correlate Your Data: Integrate your Strava data with other metrics, such as sleep, nutrition, and cross-training, to gain a more comprehensive understanding of how different factors impact your running performance and make data-driven decisions to improve your results
Key Takeaways to Supercharge Your Runs
Unlock the full potential of your Strava data by mastering its data visualization tools to gain deeper insights into your performance and progress
Utilize GPS tracking and heart rate zone training to optimize your runs, ensuring you’re pushing yourself to new limits while minimizing the risk of injury or burnout
By leveraging the power of Strava and its analytics, you can transform your running routine, set achievable goals, and celebrate meaningful milestones on your journey to becoming a stronger, more resilient runner
Unlocking Your Running Potential
By dissecting your Strava data, you’re not just analyzing numbers – you’re uncovering the blueprint to your next personal best, and that’s where the real magic happens.
Leo 'Max' Maxwell
Unlocking Your Full Potential

In this guide, we’ve covered the essential steps to analyze your running data from Strava, from understanding your performance metrics to mastering data visualization tools. We’ve also explored the benefits of GPS tracking and heart rate zone training to take your runs to the next level. By applying these strategies, you’ll be able to optimize your training, identify areas for improvement, and ultimately achieve your running goals. Whether you’re a seasoned marathon runner or just starting out, data-driven training is the key to unlocking your full potential.
As you continue to track and analyze your running data, remember that the ultimate goal is to fuel your passion for running and have fun while doing it. Don’t be too hard on yourself if you don’t see immediate results – consistent progress is what matters most. With Strava and the right mindset, you’ll be able to push yourself beyond your limits and discover new strengths. So, keep lacing up those running shoes, stay motivated, and watch your progress soar. The journey to becoming a better runner is just as important as the destination, and with data on your side, you’ll be unstoppable.
Frequently Asked Questions
How can I use Strava's data visualization tools to identify trends in my running performance and set realistic goals for improvement?
Dive into Strava’s data visualization tools to uncover trends in your running performance. Use the ‘Effort’ chart to identify patterns in your heart rate and pace, and set realistic goals based on your progress. I like to call it ‘data-driven goal setting’ – it’s a game-changer for smashing personal bests!
What are the most important heart rate zones to focus on for endurance training, and how can I use Strava's GPS tracking to optimize my zone training?
For endurance training, focus on zones 2-4, where you’re building aerobic capacity and increasing lactate threshold. Strava’s GPS tracking helps you optimize zone training by providing precise pace and heart rate data, allowing you to adjust your intensity and stay in the desired zone.
Can I integrate my Strava data with other wearable devices or health tracking apps to get a more comprehensive picture of my overall fitness and wellness?
Absolutely, you can integrate Strava with other wearables and health apps to get a holistic view of your fitness. I’ve done it with my Garmin and Apple Watch – it’s a game-changer. You can sync your Strava data with apps like MyFitnessPal or Apple Health to track nutrition, sleep, and more, giving you a complete picture of your wellness journey.